Auditing the Federal Government's Snow Day Decisions: Driven by Excitement or Weather?
Can Google Trends predict Snow Days?
How behavioral Google search data and scientific weather forecast data play into the federal government’s snow day decision-making.
As spring arrives in Washington, D.C., we close the chapter on an abnormal winter in the District: For the first time in the last five years, the federal government did not declare a single full day closure due to snow.
D.C. had its federal snow day chances. On March 14, D.C. braced for Snowstorm Stella, which threatened six or more inches. Typically, such threats cause the all-powerful federal snow day authority Office of Personnel Management (OPM) to declare a closure. But OPM didn’t bite and only issued a three-hour delay with the option to work remotely. Even my office — General Assembly’s D.C. campus, where I’m a full-time Data Science Immersive instructor — declared a snow day, as did many others. (OPM was probably right this time: Only a light dusting followed exaggerated predictions.)
Because of the excitement surrounding impending snow, it seemed like a given that OPM would issue a closure, as it has in the past. It made me think about whether there was any relationship between the emotional buildup resulting from a snowy-weather forecast and the chances of the OPM actually declaring a snow day.
I wondered: Are OPM’s opaque closure decisions truly, entirely based on the forecast, or are they also susceptible to human impulse?
To answer this question, I turned to data science.
The Data
To evaluate the root of OPM’s closure decisions, I decided I needed three datasets: the history of all federal government snow day closures, historic weather forecast data, and a heuristic method to determine human excitement leading up to a snow day.
Federal Government Closure Data
Gathering historic government data on federal closures proved simple. The Office of Personnel Management maintains a Snow & Dismissal Procedures archive. I automated the data collection and open sourced the ability for you to do the same.
Historic Weather Forecast Data
Collecting historic weather forecast data proved surprisingly challenging. Note I’m not obtaining historic weather data, but historic weather forecast data. This difference is critical: I’m basing all my analysis on the weather data that was available to OPM at the time of its decision (which I’m assuming is 11 p.m. the night preceding a snow day).
While gathering historic weather data is quite straightforward, historic weather forecast data is a bit harder to find. I suspect this is because weather reporters would rather release what happened than what they thought would happen — I should audit weather reporters for my next project.
I used an API called Dark Sky and open sourced my script for doing so.
Behavioral Snow Day Excitement Data
To collect behavioral data on the excitement surrounding a possible snow day, I turned to Google Trends. Google Trends enables anyone to see the popularity of a search term within a given geography and time range. This is an excellent way to encapsulate snow day excitement: Rumors of snow encourage searches for news coverage and forecasts.
Google supports the ability to collect the last five years of Trends data at the weekly level. Units are measured on a 0 to 100 scale based on relative search volume, where a term achieves a 100 at its most popular search frequency within the user-provided timeframe.
The Analysis
Before examining how each factor plays into a snow day, I first visualized what OPM’s closure decisions have been like over time.
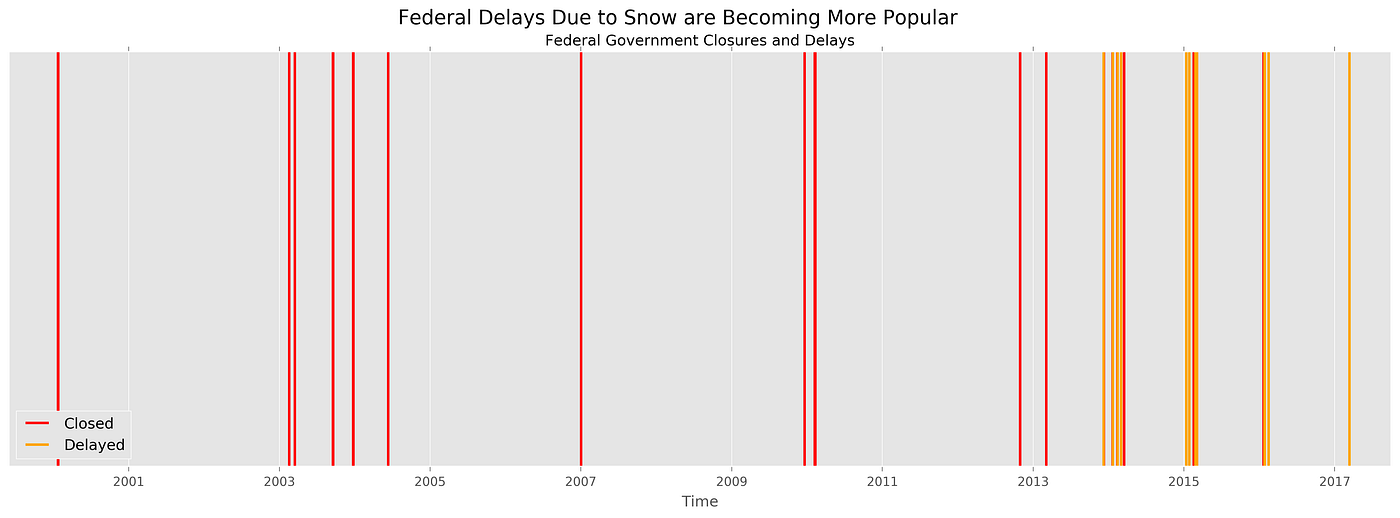
In the dates available on OPM’s public archive stretching back to 1998, the federal government has declared 13 closures and 13 delays. Delays are becoming increasingly common. Perhaps the advent of telework has enabled the federal government to trade what would have been delays to remote working. The first recorded telework notice available in the dataset is December 16, 2010. (Thanks, Obama.)
I then looked at the five-year Google searches for “snow” data within the D.C. area over time.

If you were to look at the graph above, could you guess what days were snow days based on relative Google “snow” search volume? Recall that this data is only available at the weekly level, so spikes correspond to a week’s aggregation of Googling. Y-axis values are relative search volumes, so weeks in December 2014 saw almost half the volume of “snow” Googling that Snowzilla saw in 2016.
Layering the federal closure data on top of the Google five-year weekly search volume yields an intriguing graph.
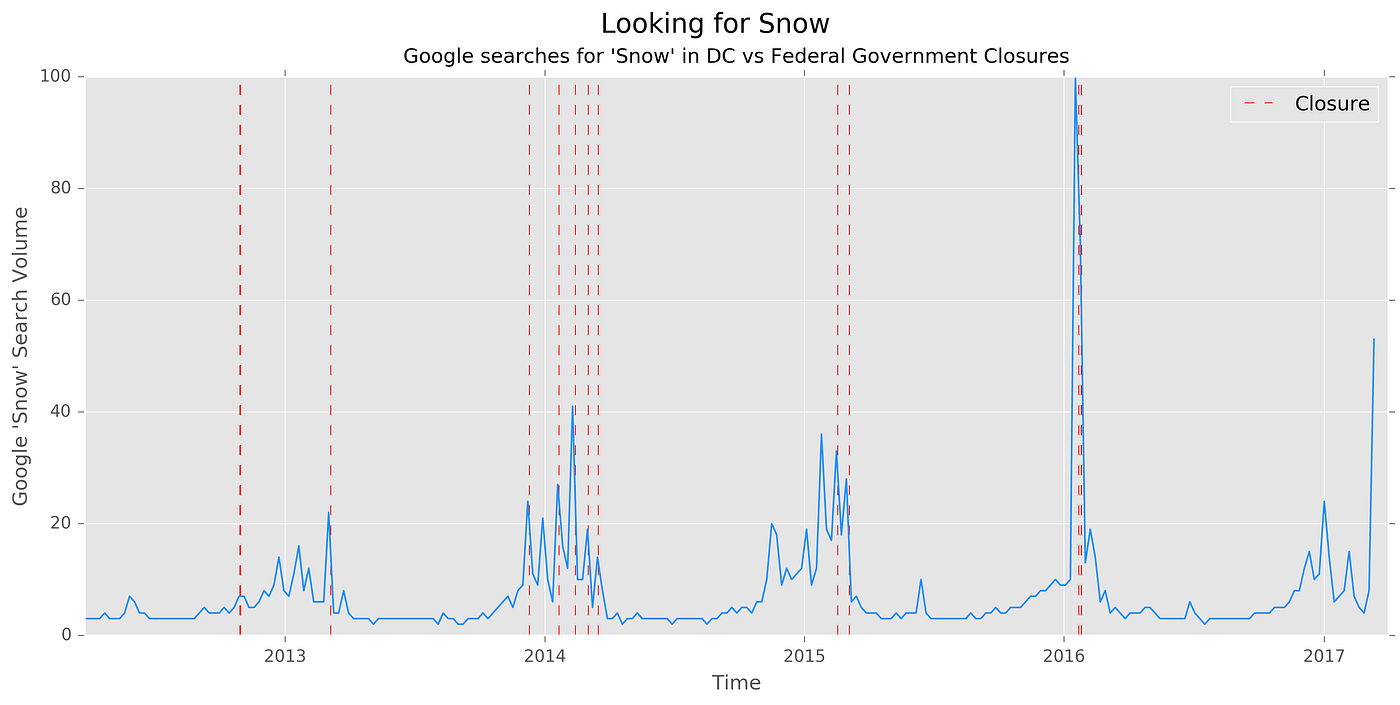
Looking at this graph alone paints OPM to be fairly reactionary to Google behavioral snow day expectations. Almost every time Google “snow” search volume exceeds 20 percent of its relative Snowzilla 2016 peak, there has been a snow day. Immediately, the week of March 12, 2017, stands out. If Google searches are people saying they think there will be a snow day, this March proves extremely disappointing.
The weather data I collected provided temperature, 10-mile visibility, wind, precipitation probability, precipitation intensity, and precipitation type. I first plotted closures vs. forecasted precipitation probability and colored it by type (rain or snow).

A couple of important trends emerge. Nearly every time expected snow probability exceeds 50 percent, a closure is expected. There were a few weeks in 2014 in which this was not the case, but subsequent forecasted snow pushed OPM over the edge. Starkly, the probability of snowfall in March 2017 surpassed that of Snowzilla 2016 by roughly 10 percent.
Moreover, there appear to be just two weeks where forecasted rain caused a closure, both in the 2012–2013 winter. This demonstrates the significance of interaction terms. Of course the federal government does not close every time rain is forecasted, but perhaps the interaction of low temperatures and pending rain will result in closure.
So, I plotted a 10-day rolling average of forecasted temperature versus closures.
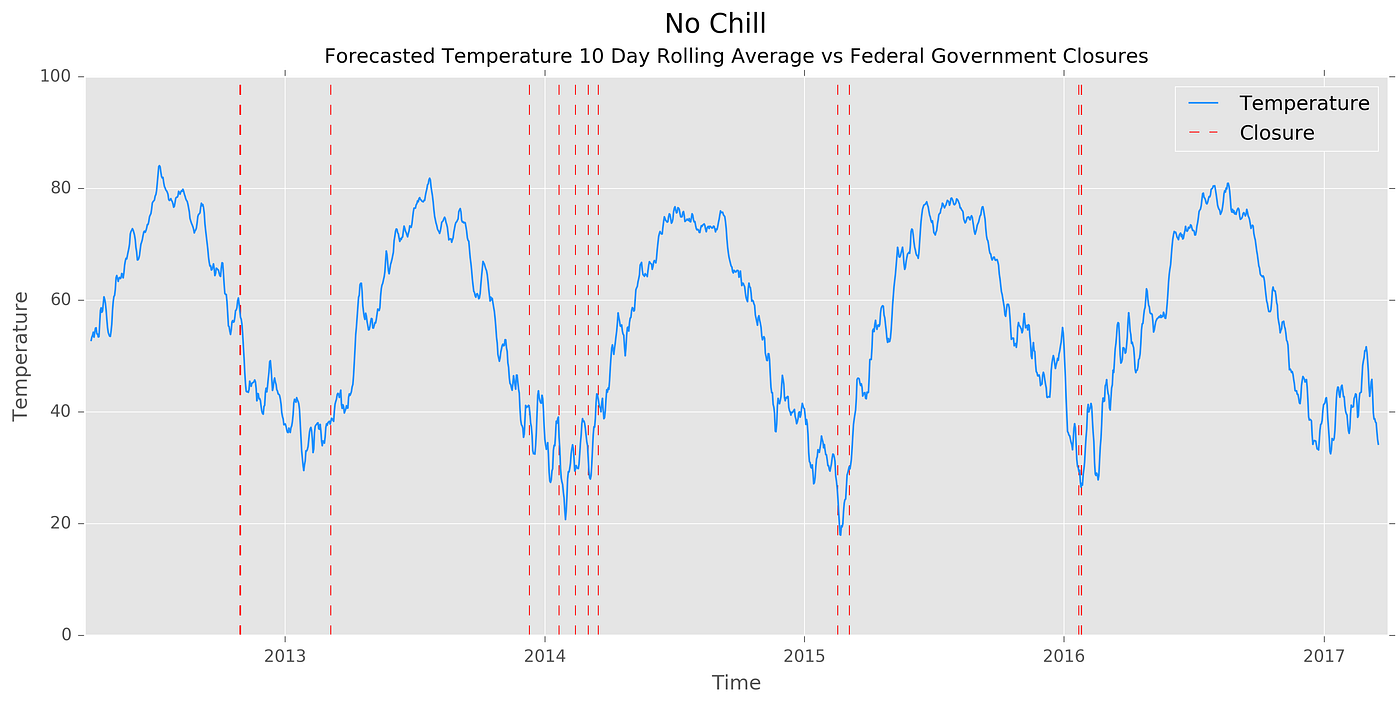
While it is hard to say a low temperature alone determines closure, the winter 2012 closure is explained. A heavy amount of forecasted precipitation in tandem with low temperatures caused OPM to call off work.
Modeling
While I won’t get into depth on the modeling tactics I used (see code), I’ll provide intuition into my process. I built models to predict whether I can successfully determine whether OPM will have a snow day in a given week based on the average weather data for that week and the Google search volume for “snow” in D.C. (Recall my analysis must exist at the weekly level due to Google Trends data only being available for the previous five years at the weekly level.)
Logistic Regression
I first fit a logistic regression, which is a fancy way of saying created a line based on some inputs to best guess future points on that created line. A logistic regression enables me to accept or reject whether some given features — in our case, Google searches and weather information — explain a given output (OPM closures).
The most explanatory (statistically significant) features for an OPM snow day are forecasted temperature, forecasted precipitation intensity, the interaction of forecasted temperature and precipitation, and the forecasted snow intensity. In other words, OPM bases its decision most on temperature and precipitation. We can reject the idea that Google searches for “snow” explain whether a given week will include a snow day (at the 5% significance level, no less).
In addition, with this fit model, I tested whether the week of March 12, 2017, would include a likely snow day. The model assigned this a 0.02% chance — if only I had built this before getting my hopes up.
Random Forest Classifier
The second model I built is a random forest classifier. A random forest is a fun way of saying a collection of decision trees — like a simple way of determining whether you should go for a run on a given day. If it is over 50 degrees, perhaps you decide you should. If it is not warm, you then ask if you have a gym membership. If yes, you run at the gym. If not, you stay home.

Decision trees measure the importance of a given feature based on how much information that feature provides when seeking an outcome. In this exercise example, having a gym membership alone may not mean I will go running. A gym membership is only relevant if the weather is cold. Thus, the added value of information regarding a gym membership (measured using something called Entropy) is lower than the weather information.
In the OPM problem at hand, I provided the random forest (the best weighted-average of a collection of decision trees) the same weather and search data. The model achieved a 95.4% accuracy in classifying whether a given week would have a snow day, and a 1.0 precision rate. I plotted the various feature importances (measured by Entropy, information gain).
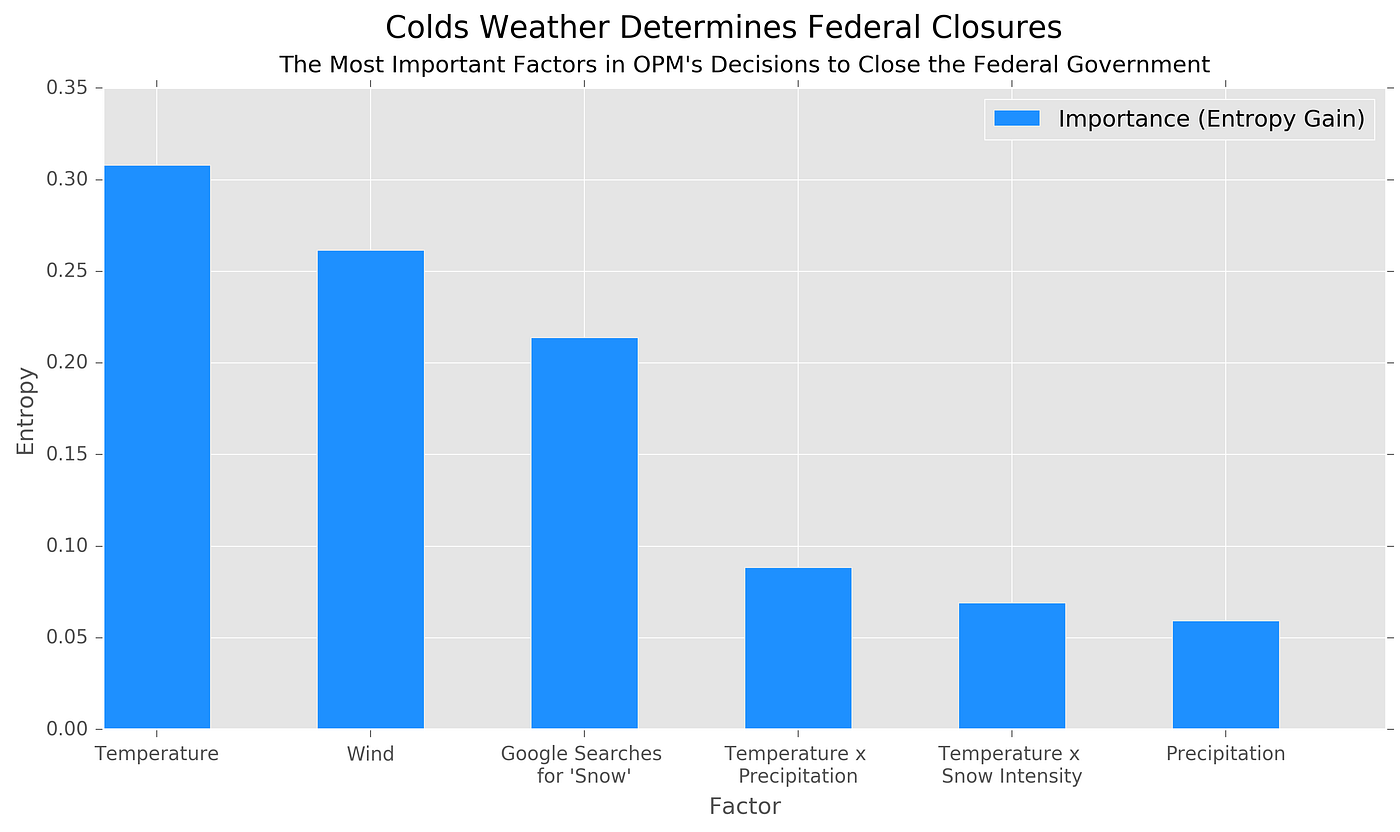
The model found temperature to be incredibly important as well as wind. Perhaps OPM finds that wind makes for more dangerous weather, regardless of precipitation. Google searches for “snow” proved to be the third most valuable feature in classifying if a given week as likely to have a snow day or not while the interaction of precipitation type and temperatures also remain insightful.
I used this same highly accurate model to predict if the week of March 12, 2017, would contain an OPM closure, and it correctly predicted there would not be. Given both the logistic regression and random forest classifier correctly predicted there would not be a snow day, I am reminded of one of my favorite data comics.
Results
So where does that leave us in determining whether the Office of Personnel Management relies on purely scientific factors vs. behavioral ones in predicting a snow day? It appears that OPM largely, if not entirely, abides by weather forecasts. However, given the marginal explanatory power behavior-driven Google searches provided the second model, one is inclined to believe even bureaucrats may be prone to human excitement.
Full analysis, including the datasets and methods not covered in this writeup, are available on my Github. If you’d like to stay up to date on tutorials of how I completed this, subscribe to this publication.